Fashion Cents Lancaster PA Secrets: 7 Insider Steps to Score Big on Hidden Gems!
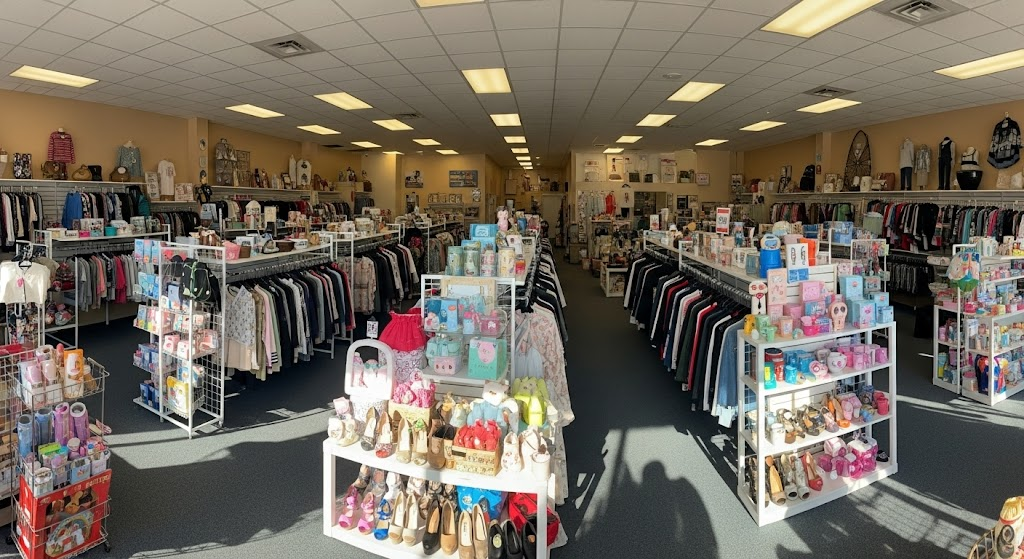
If you love shopping smart, saving money, and finding unique pieces that fit your style, then Fashion Cents Lancaster PA is your dream destination. Whether you’re a local resident or just visiting Lancaster County, this consignment and thrift chain offers an incredible shopping experience. Fashion Cents Lancaster PA is not your average secondhand store. It […]
Fashion Cents Lancaster PA Secrets: 7 Insider Steps to Score Big on Hidden Gems! Read More »